Restoration Business Profit Margins: Benchmarks, How to Set Them and Protect Them


Setting your profit margins properly is essential in an industry where profit tends to shrink the larger a company becomes. More revenue doesn’t mean more profit if you’re not watching your bottom line and paying close attention to what’s happening inside your organization as you scale.
A company making $3M that has a 35% profit margin is in a better position than one that’s making $7M and showing a 20% profit margin. The restoration companies making healthy profit margins take an efficient approach to documentation, scope and estimation processes. Here’s a practical look at how not to end up in a spend-more-to-make-less scenario as you grow your restoration business.
What's a Good Profit Margin for a Restoration Business?
According to the latest statistics from the Restoration Industry Association’s (RIA) Cost of Doing Business Report, healthy restoration companies typically run ~50% average gross margin and roughly 10-15% net, with wide variation by service line and company size. The smallest companies in this business (under $1M) are reporting the highest average net income (~30%), while the largest (over $50M) are only earning ~6%.
According to the RIA, much of that gap comes down to revenue mix: larger companies tend to take on more reconstruction work, which carries lower margins than mitigation. I see a second factor on the ground: as companies grow, jobs stop getting done as efficiently. In fact, ~7% of companies are losing money in restoration.
For example, drywalling a full house will naturally take longer than patching a 2ft cutout, but the pace per square foot should stay the same. In practice, that's often not what happens, and bigger jobs end up running less efficiently. It’s not uncommon that teams go in for the larger, more financially attractive contracts, only to discover that a $100,000 job costs them $90,000.
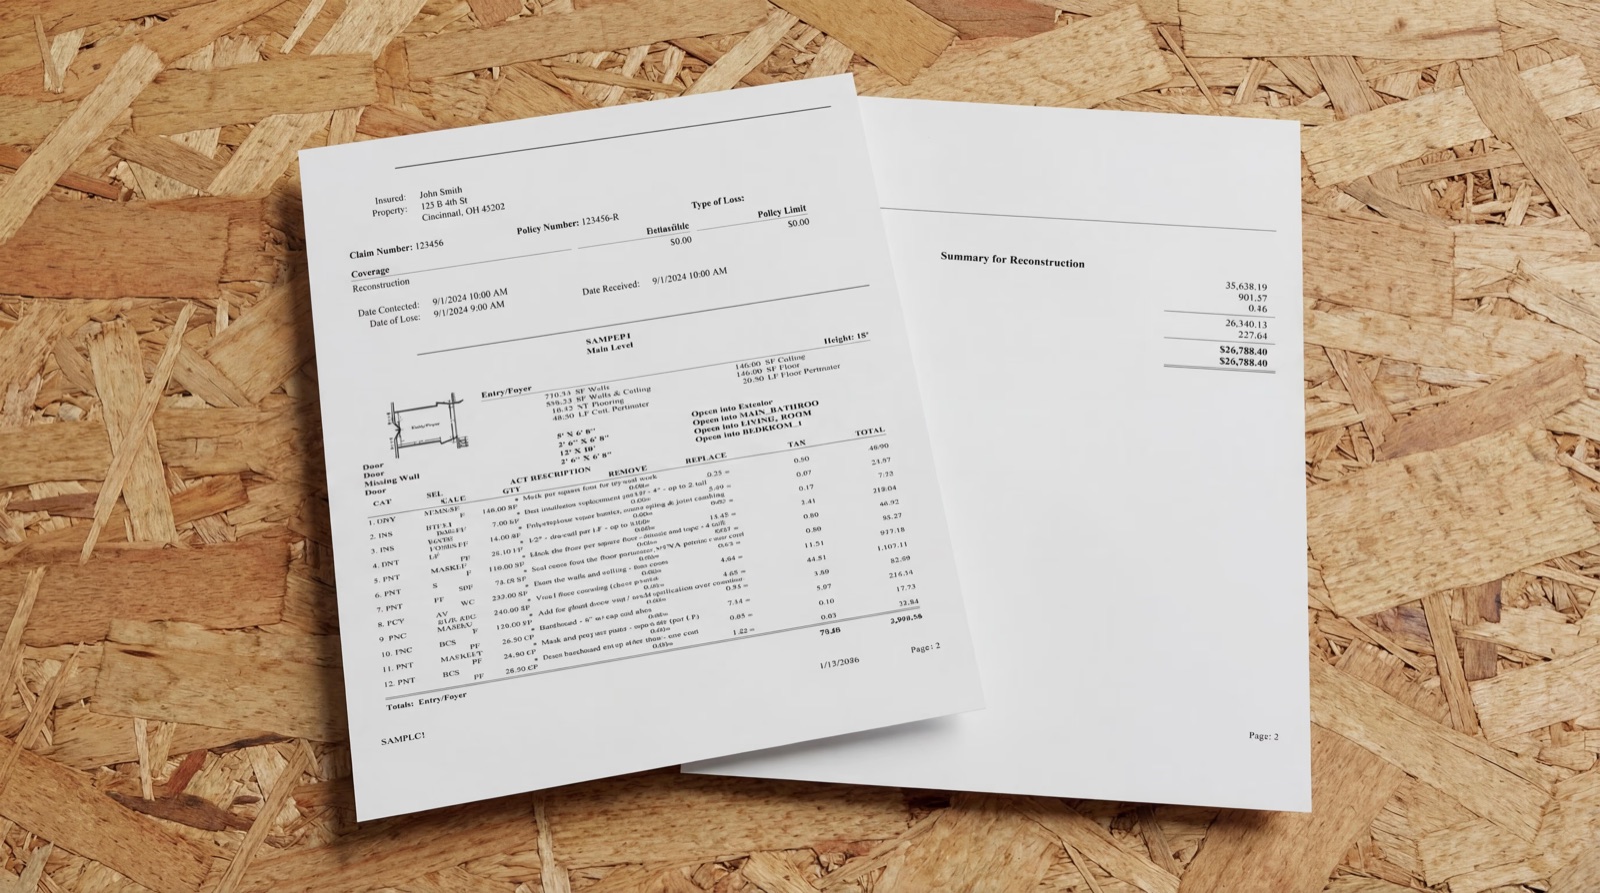
The standard 10&10 overhead-and-profit assumption no longer reflects what it costs to run a restoration business. According to the RIA, most companies carry overhead of 27–38% of revenue, driven by 24/7 availability, specialized equipment, regulatory compliance and administrative complexity. And because both markups are applied to cost, 10&10 delivers a margin of about 17%, not the 20% it implies.
The better option is to build a more realistic overhead into pricing and become more disciplined at controlling it to keep costs in check.
Gross Margins by Service Line
Profit margins are greatly impacted by the nature of the work itself. Whether a company decides to take on low-margin jobs vs. high-margin ones, or non-mitigation vs. mitigation jobs is both a service decision and a pricing decision. Based on the Restoration Industry Association’s (RIA) Cost of Doing Business Report, here is the baseline gross margin per service area:
Mitigation
- 46% of respondents reported 50-69.9% gross margin, followed by 28% reporting 70-99.9%.
Reconstruction/Repair
- 63% of respondents reported 30-49.9% gross margin, followed by 15% reporting 20-29.9%.
Contents
- 38% of respondents reported 50-69.9% gross margin, followed by 30% reporting 30-49.9%.
Job Size and Counterintuitive Margins
The RIA’s report notes that a reconstruction job that makes an average of under $5,000 has an average ~18% net profit compared to an ~11% profit on a job that averages $50,000+. Keep that in mind when your instinct tells you to chase big contracts. They might seem safer at the outset, until you’ve crunched the numbers after the job is completed.
Large restorers handling bigger mitigation jobs ($20K–$50K) are feeling marketplace swings in their direct job costs. Many likely cut headcount to control costs, only to lean on subcontractors and temporary labor instead, which makes each job more expensive to run than it would be with an in-house crew.
Markup vs. Margin: The Mistake That Shrinks Profits
When restoration businesses use markup to set prices, they often miss their true margin target. The result is slimmer profits and a constant struggle to stay ahead of rising costs.
Markup is based on cost. Margin is based on the revenue/sale price.
Here’s a simple example based on a cost of goods sold of $100. For this example, the COGS is labor, materials, subcontractors, equipment rentals and other direct job costs.
Add a 10% markup to reach your sale price = $110.
This sale price is an estimate of the total cost + profit.
Profit = Sale Price - Cost of Goods. In this case, the profit = $110 - $100 = $10.00
Margin = Profit ÷ Sale Price ($10 ÷ $110), so in this case, the margin is 9%, lower than the 10% markup.
This 1% difference may not seem like much, but across hundreds of jobs, it adds up quickly.
How to Set Profit Margins in Your Restoration Business
Start With Cost Clarity
You can’t set a healthy margin until you know your true costs. That includes labor and benefits, materials and equipment, administrative expenses, and overhead like rent, utilities, software, and training. Add up every cost, accounting for windshield time of your most expensive employees, to find your break-even point. From there, you can decide how much you need to charge to stay profitable.
Define Your Target Margin
There’s no one-size-fits-all margin. Smaller companies that operate from a garage may run lean, while established firms with full-time staff and office space carry more overhead. Most healthy restoration businesses aim for margins that allow them to reinvest in growth and absorb unexpected costs. The important thing is to know your numbers instead of copying what your competitors are doing.
Choose a Margin Strategy
Once you know your costs and target profits, you can choose a strategy for applying margin. Some businesses prefer to build it into labor rates. Others apply it at the end of an estimate. Some use time and materials. The method matters less than making sure you include it consistently and where it makes sense.
Why Restoration Jobs Lose Margin – and How to Stop It
The leaks tend to fall into two categories: the ones you can't control, and the ones you can.
External Pressures
Some margin pressure is just the cost of doing business in restoration today. You can't control these, but you can price for them:
- TPA fees — anywhere from 4–10% per job, taken off the top before the job begins
- Rising carrier scrutiny — adjusters increasingly flag line items that don't match guidelines, even when those guidelines don't reflect actual jobsite needs, and leaning on AI without properly reviewing your estimating is only adding more flagged items they can push back on
- Materials and labor inflation — price swings can erode margin mid-project, especially on longer jobs
- 60+ day payment cycles — even a well-documented, well-priced job still ties up cash flow for weeks or months before it's collected
You can’t control a carrier’s payment terms, but you can make sure your file is never the reason the check is late. With DocuSketch documentation feeding directly into DocuSketch Estimating, every line item is backed by what was captured on site, so claims move through review on fewer passes.
Internal Leaks
The bigger factors affecting margin are in your workflow, which means leaks start well before payment becomes an issue:
- Incomplete documentation — missed line items, denied supplements, and disputes with adjusters almost always trace back to documentation that doesn't clearly support what happened on site. A good rule of thumb: if you're pricing new drywall, provide a photo of the drywall that needs it. Nothing more, nothing less.
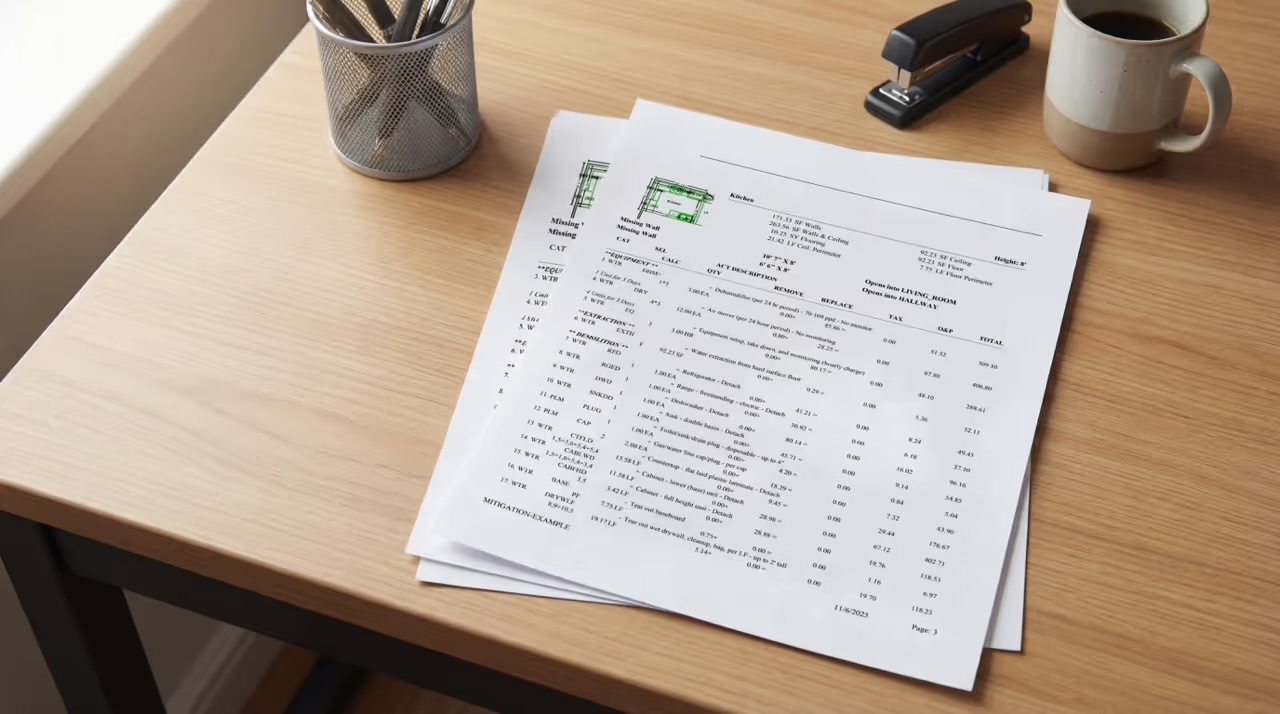
- Estimating disputes — inconsistent or incomplete estimates risk rejection and cost time. Fighting for an extra $800 in disputed line items can end up costing $1,500 in lost time chasing it. Make sure every line item is defensible with documentation.
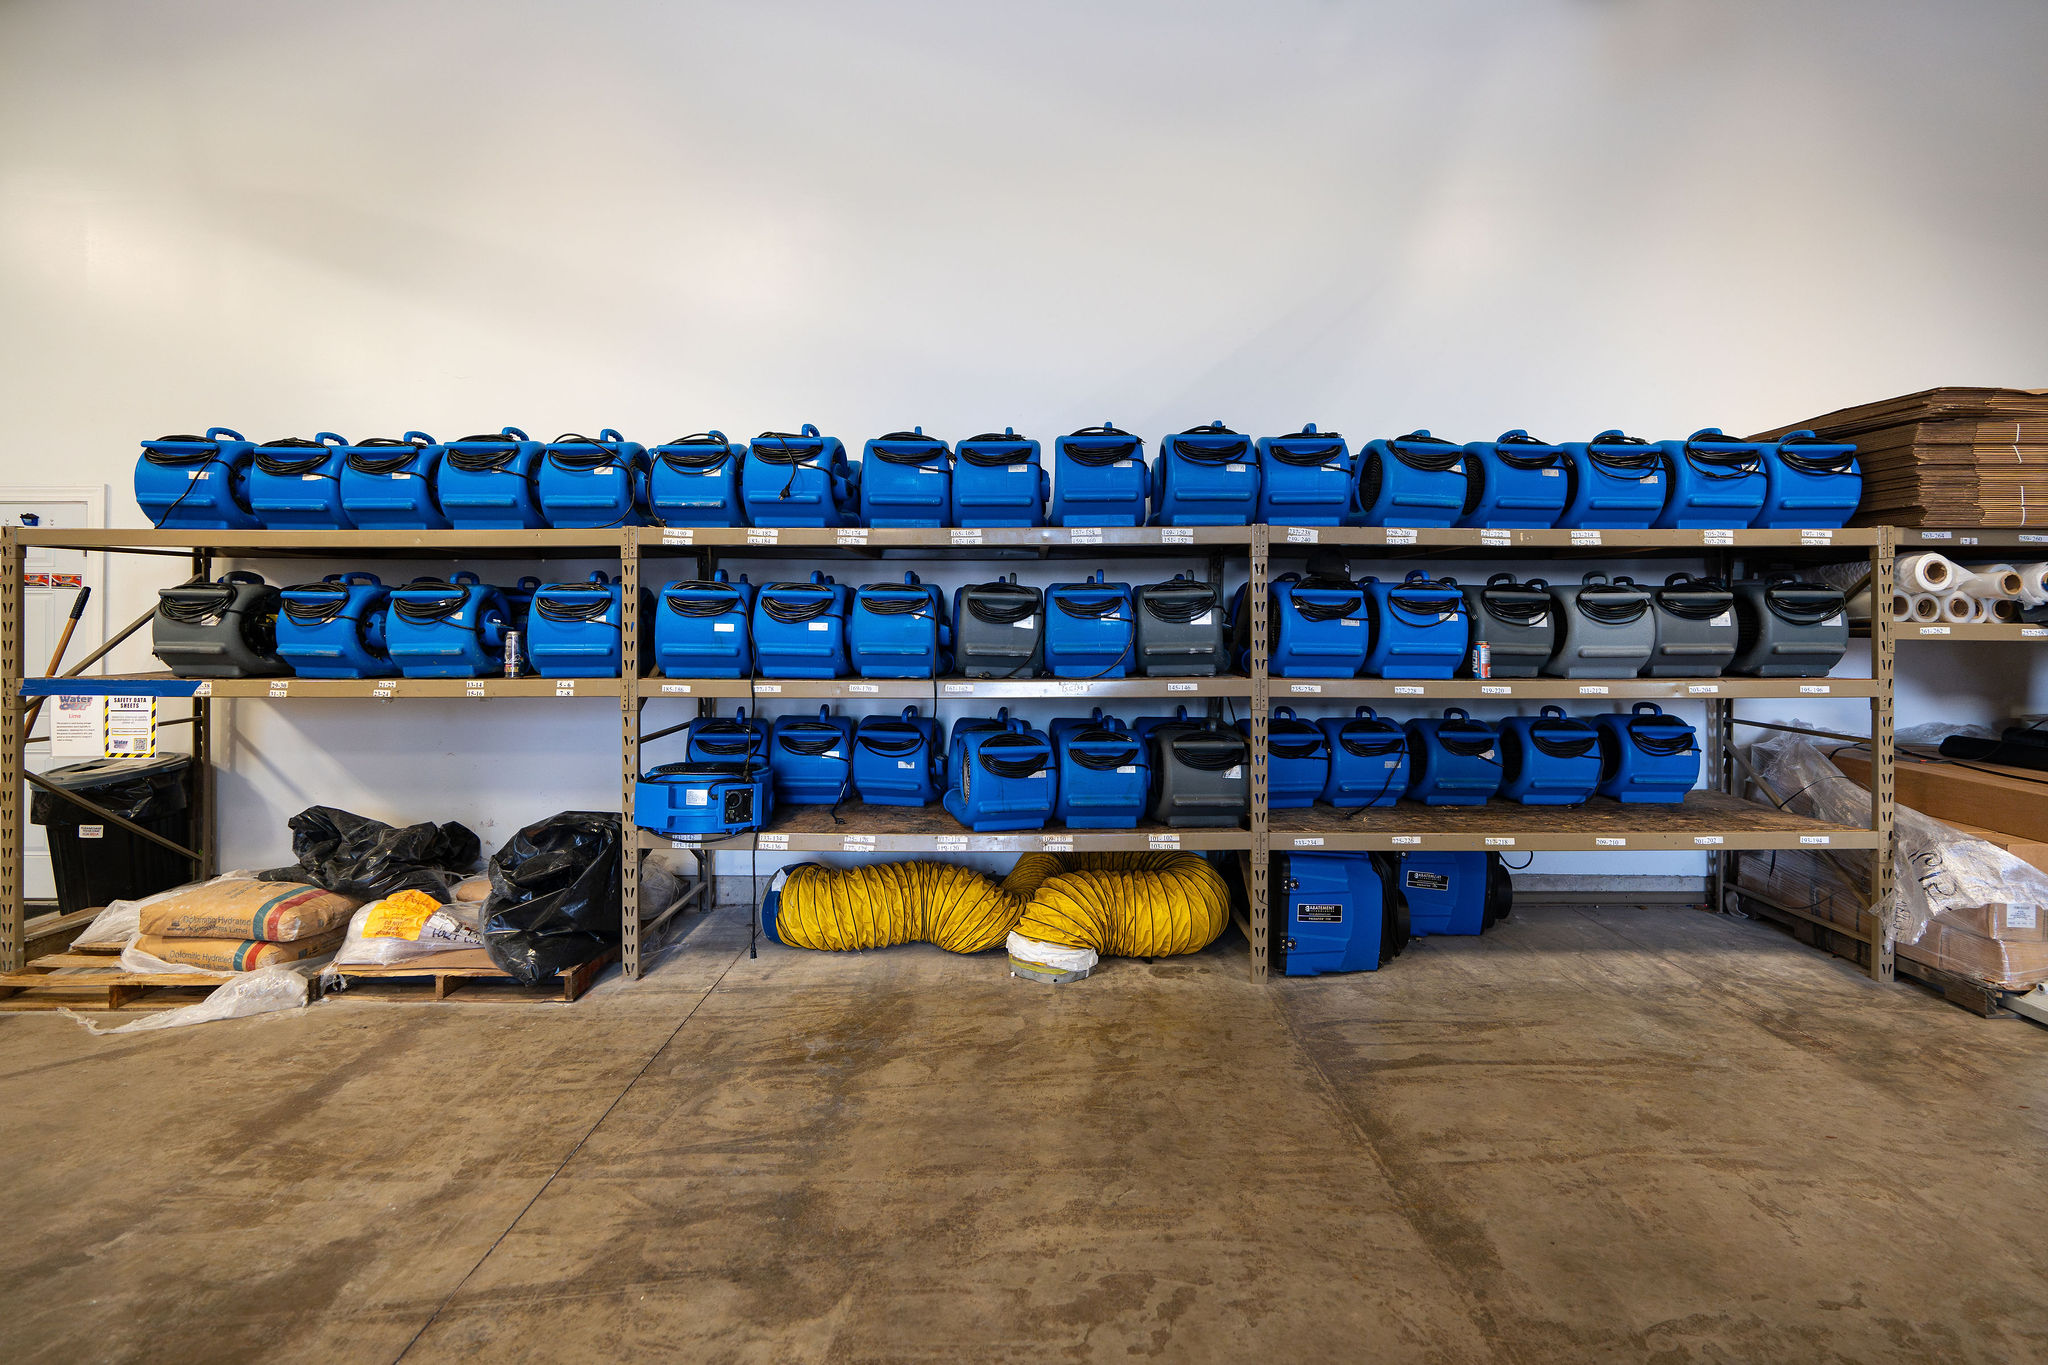
- Unbilled equipment days — equipment brought to a site that doesn’t make it onto the estimate can erode a job's profitability without ever showing up as an obvious mistake. For a deeper look at this specific leak, see our Restoration Equipment Tracking Guide.
- Scope creep without pace to match — a larger job should have a price that matches a reasonable timeframe. A drywaller who takes three extra days on a bigger job — rather than working at the same efficient pace that made a smaller job profitable — is a direct hit to margin, even though the estimate itself looked fine on paper.
- No post-job margin review — without circling back to compare estimated vs. actual cost, companies can be in the dark about their profit margins, not knowing why until the pattern repeats at scale.
The Fix Is a Workflow, Not Necessarily More Spreadsheets
Poor documentation causes scope disputes, which cause payment delays, which compound against companies already running thin margins from TPA fees. You can solve for this by making documentation, estimating, and QA part of one workflow instead of three separate steps.
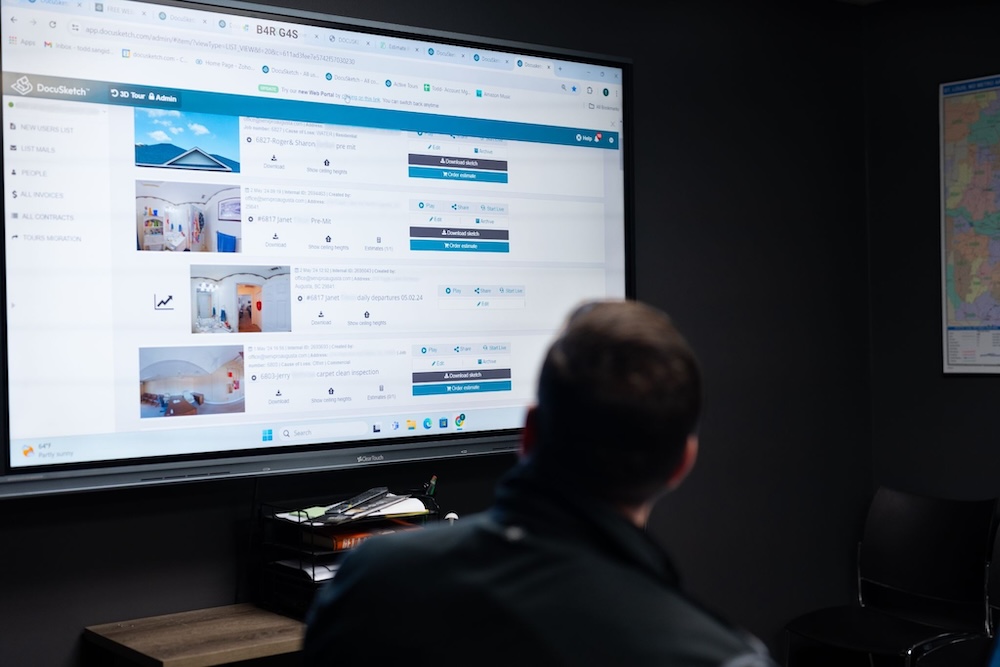
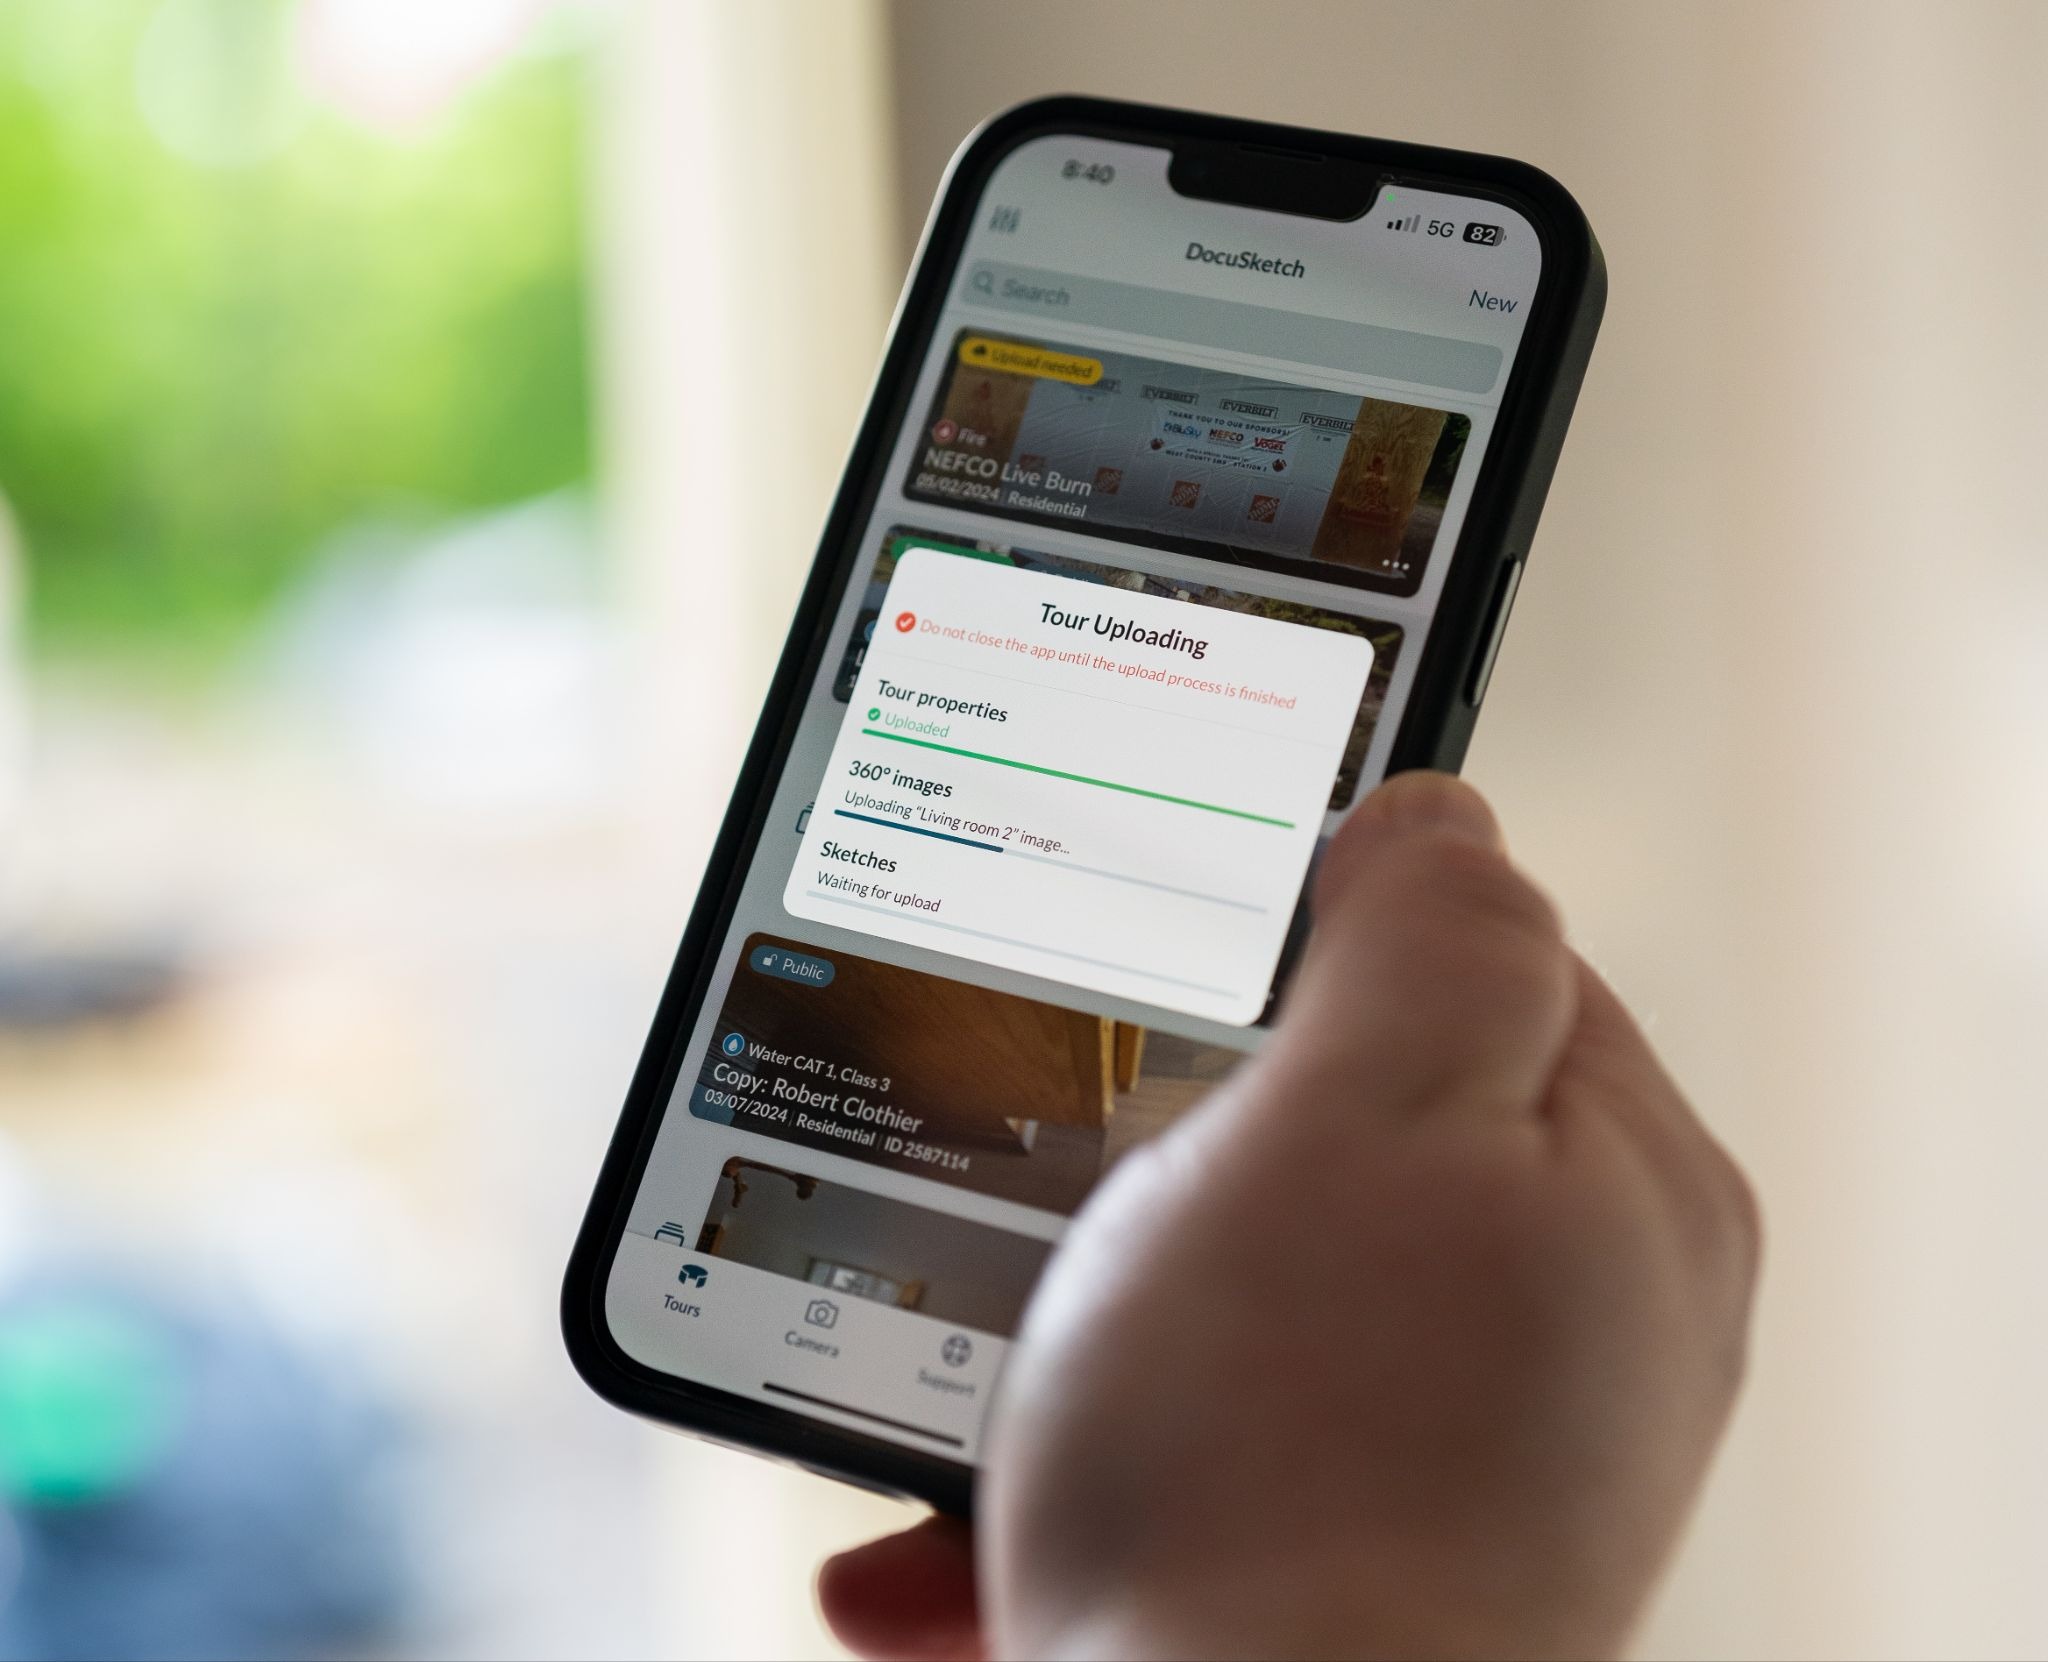
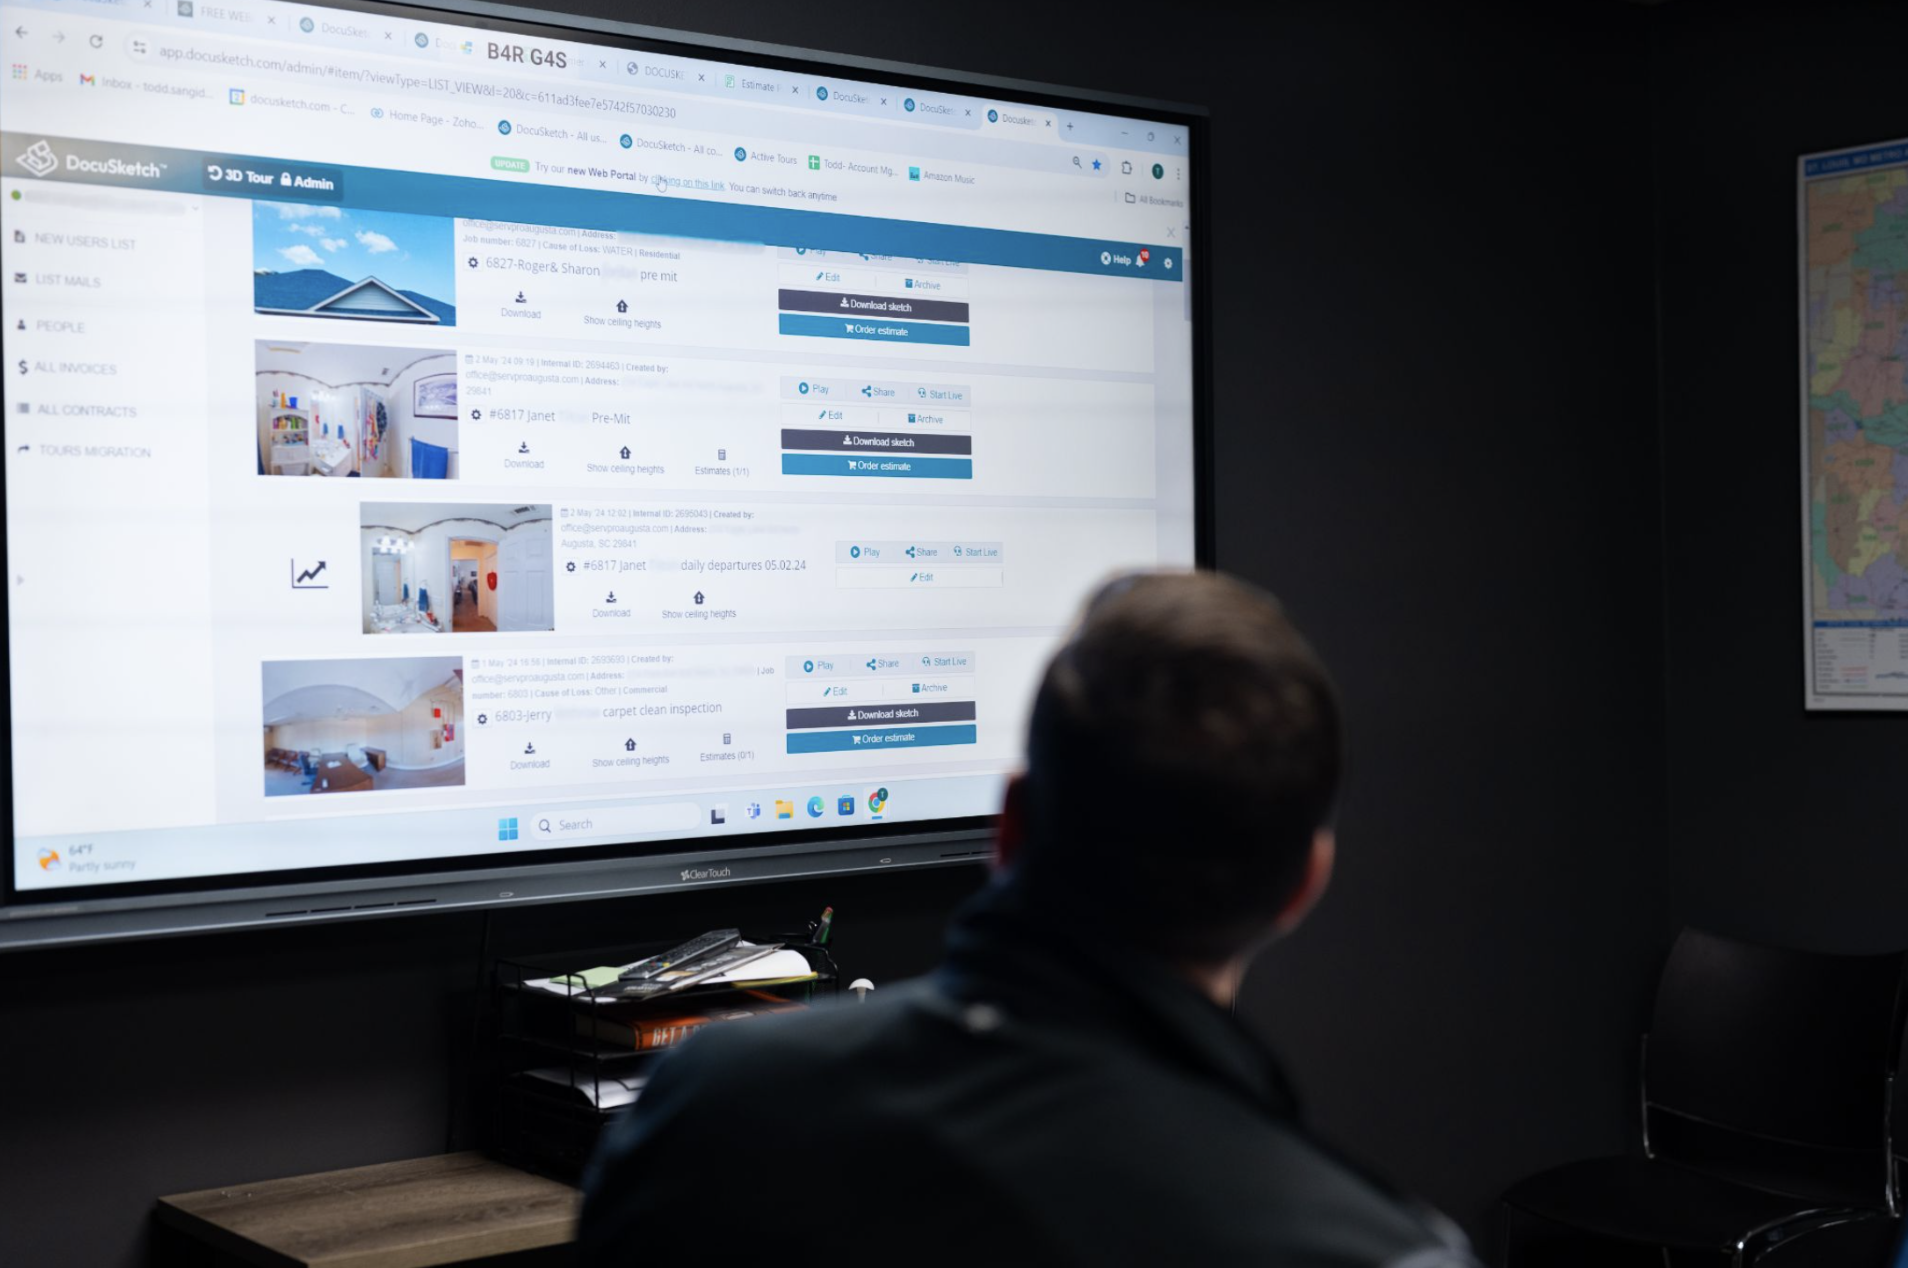
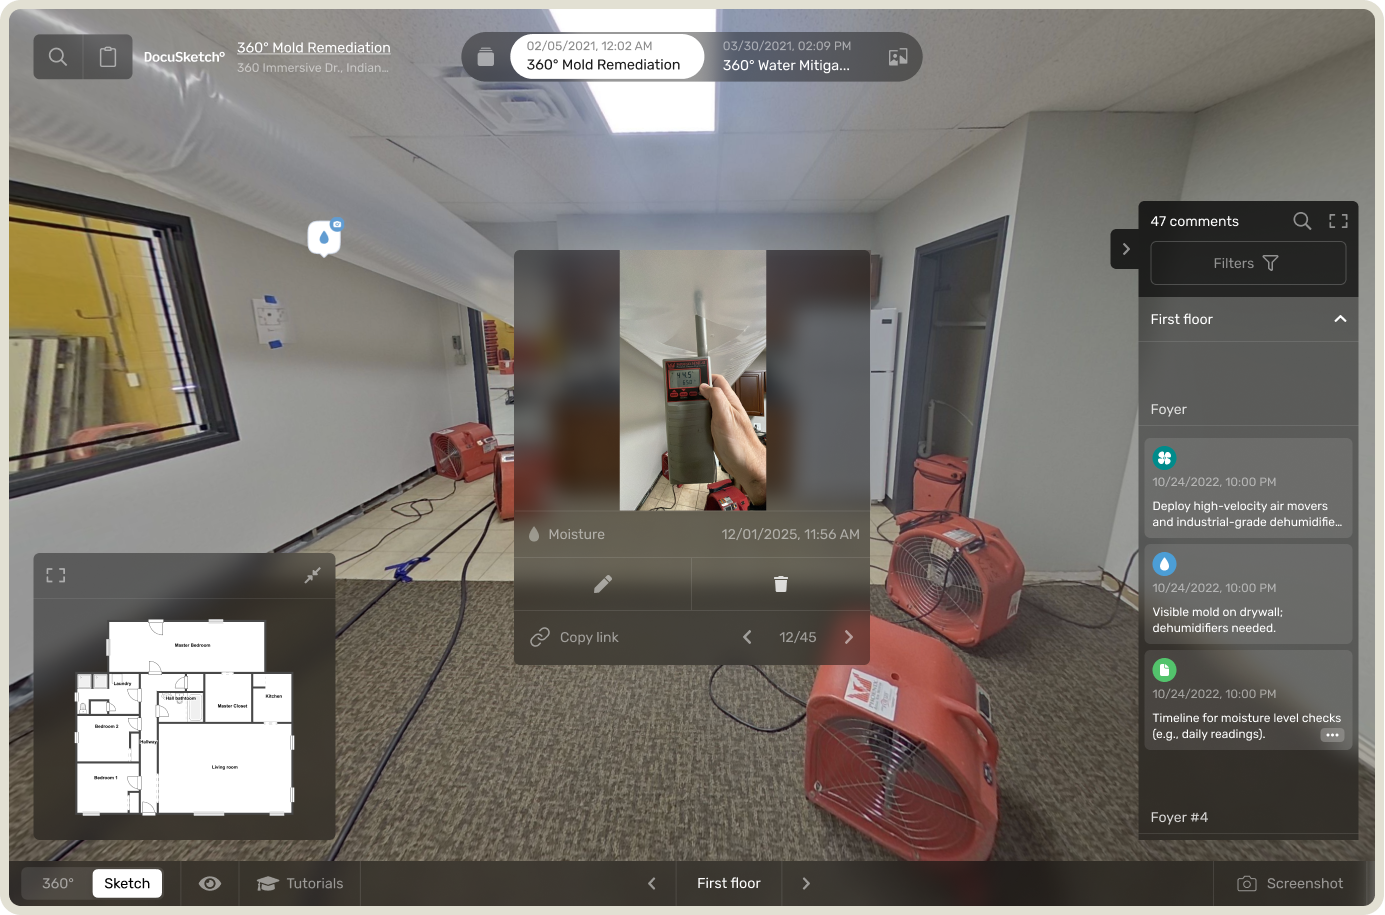
- Document everything, quickly. DocuSketch's 360° capture lets field techs gather complete, timestamped visual documentation on site without adding administrative time that eats into margin.
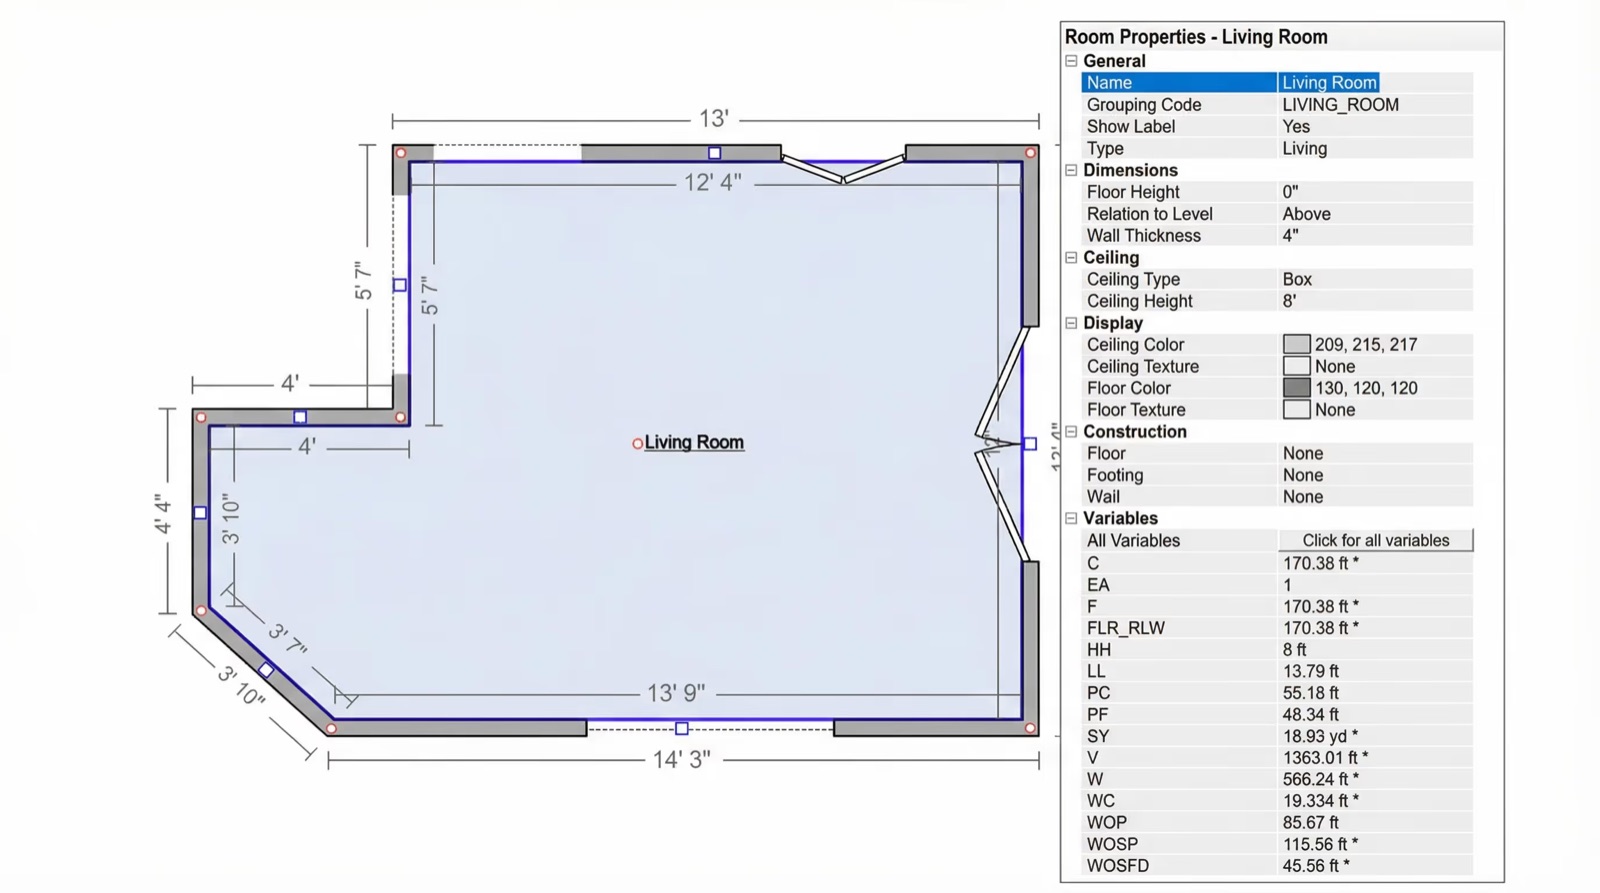
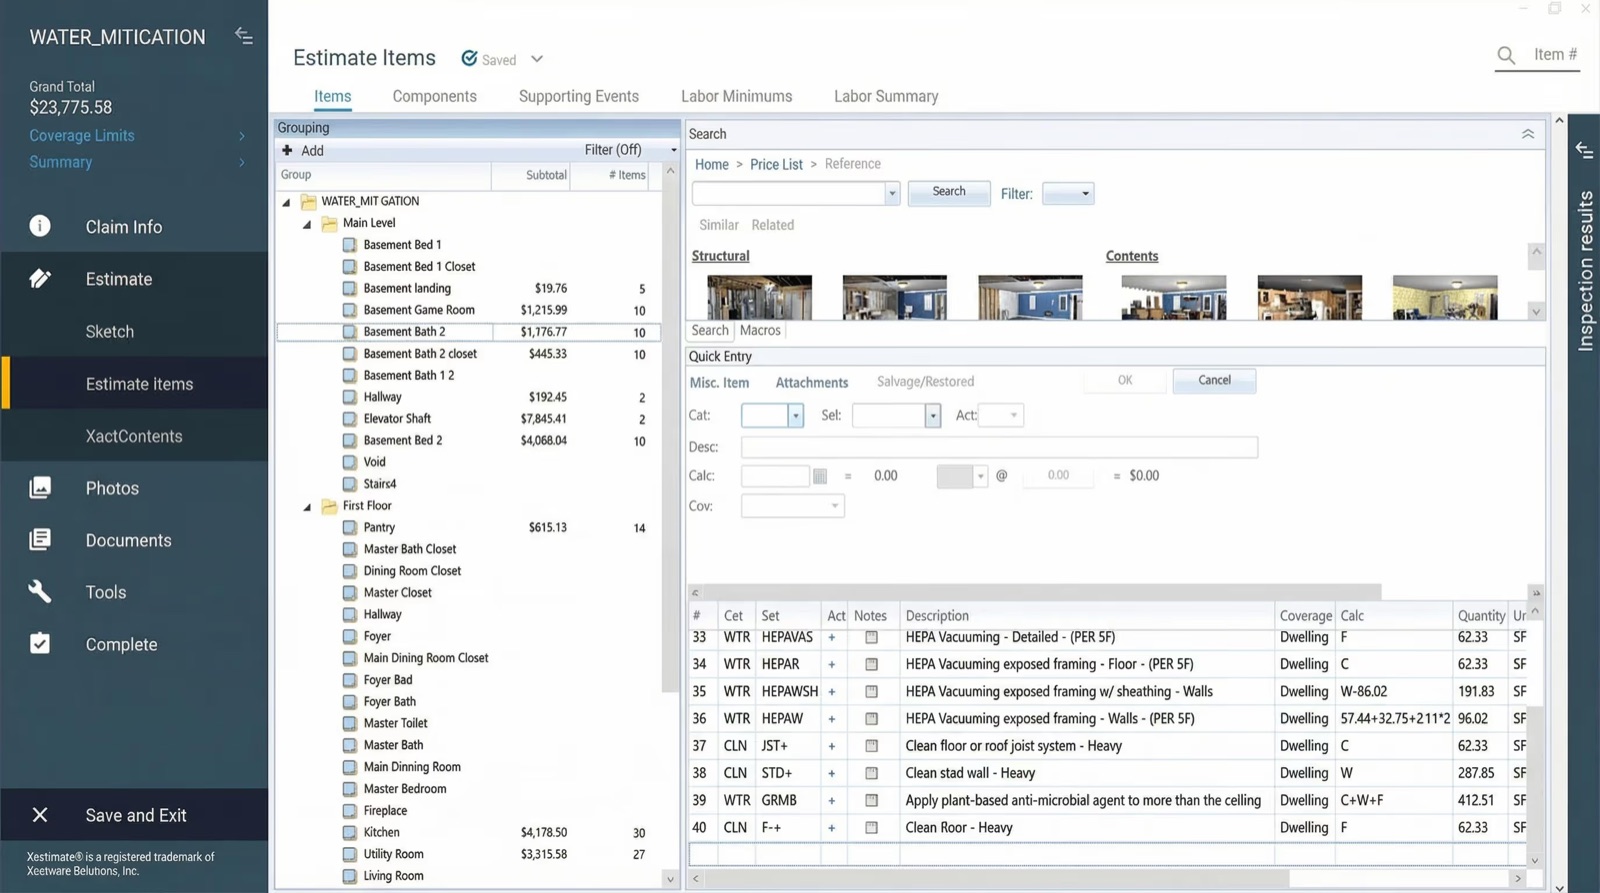
- Build the estimate from complete documentation. The sketch-to-Xactimate flow gives estimators the chance to work from accurate, fact-based documentation from the get-go, rather than reconstructing the story after the fact when carriers ask for proof.
- QA the estimate before it's submitted. The DocuSketch Estimate Grader catches missed line items and pricing inconsistencies before a carrier or TPA sees them, pre-emptively shutting down any possible disputes, rejections, and sunk-cost arguments.
However you end up doing the math on profit margins, make sure you’ve worked backwards from your costs, calculated for organizational inefficiencies, and used razor-sharp estimation and documentation tools to get X-ray precision on the full scope of the project. That level of detail and careful planning will help grow your restoration business sustainably.

Related Articles